


If you don’t measure success, you don’t know whether you’ve reached it or only halfway there.
The golden rule of marketing throughout the entire history of times has been: “Measure everything.”
Vlad Flaks, CEO of OWOX BI, a marketing analytics platform, shared that 47 percent of companies are only planning to implement data analysis tools.
Nearly half of online businesses don’t consider
You Can’t Afford to Lose
- Your time. It takes a lot of time to guess, make mistakes, and correct them. This cycle is going to make things worse and worse month over month.
- Your budget. Wrong decisions cost money. And having to correct it may cost even more. Run inappropriate social ads and lose all your budget for nothing.
- Your customers. If you can’t see what’s happening with your traffic: where it comes from, how visitors explore your store and products, how they react — you can’t lead them, you can’t communicate with them, and you can’t influence their decisions.
- Your brand. If you can’t connect with your customers the way they expect, you will lose their loyalty. Reading your customers’ needs by their behavior is vital.
- Your business. Without business data, you’ll be wandering in the dark, losing loyal companions, money, and your identity as a brand. Your business will be lost.
Benefits of Tracking Business Data
- You’ll make
well-thought business decisions, backed by statistics and trends. No more guessing, gambling, and hoping. Only accuracy and efficiency. - Your response to important events will get faster. With visible trends, you’ll be able to precisely offer what customers need: more relevant products, more services, and more care.
- Control budgets on commercial campaigns. Discover what people are searching for and make an offer matching their desires and intent. Using business analytics helps you maximize every spent dollar.
- Advantage against competitors. Shift from descriptive analysis to predictive. Having essential data will open up perspectives; it will show you how to improve your business and grow. Plan your strategy based on data and be one step ahead of your competitors.
Measure everything and make
data-driven decisions for success.
How to Measure Your Business Performance
To measure success, you need the proper tools.
Simple traffic analysis won’t win you the game. You need a tool that combines and blends a broad range of data — web traffic, sales, website performance, and marketing activities.
The only tool at the moment that gives you all of that is Google Analytics (or GA). And it’s free of charge. Over 37 million websites use GA to track their efficiency, according to BuiltWith data. Google Analytics is the most used tool for monitoring online business performance.
Use GA to get all your online store business data in one place quickly and effortlessly.
What is Google Analytics
Google Analytics is a web analytics service offered by Google that tracks and reports website traffic. Google launched the service in November 2005 as a solo service, but it’s currently a part of the Google Marketing Platform.
GA is on a mission to give businesses a free tool to gather and analyze data in one place. This allows you to gain a deeper understanding of customers and make calculated decisions.
For
Why Use Google Analytics
Google Analytics is FREE, and it gives you crucial information about your business and your visitors. It provides:
- Traffic source data
- Sales figures
- Conversion rates
- Customer demographics
- Devices and technologies your visitors use
- Country of origin
- Info about your marketing campaigns
- Website load speed to visitors
You can use this data to:
- Track email marketing success. Use GA to figure out how many visitors land on your site through email to calibrate your newsletter’s success.
- Measure visitor engagement. The longer a customer stays in your online store, the more engaged they are.
- Measure marketing efforts. Track your traffic coming through social media and search engines to measure your marketing campaigns’ effectiveness.
- Conversion rates. Figure out how many of your visitors become paying customers. It’s great for tracking sales figures and conversion rates.
- Visualize sales funnels. Use goal tracking and funnel visualizations to understand your checkout process better and optimize it.
How Businesses Use Google Analytics in Practice
We’ve gone through obvious reasons to use GA for measuring effectiveness. But what’s next? How do you use that data? In short: optimize performance and plan your next step to the top.
Let’s see how businesses use the insights revealed during data mining and analysis.
As of 2018, 60 percent of organizations used their data insights to drive costs and processes’ efficiency. While 57 percent of them admitted, they were building their business strategy based on data analysis.
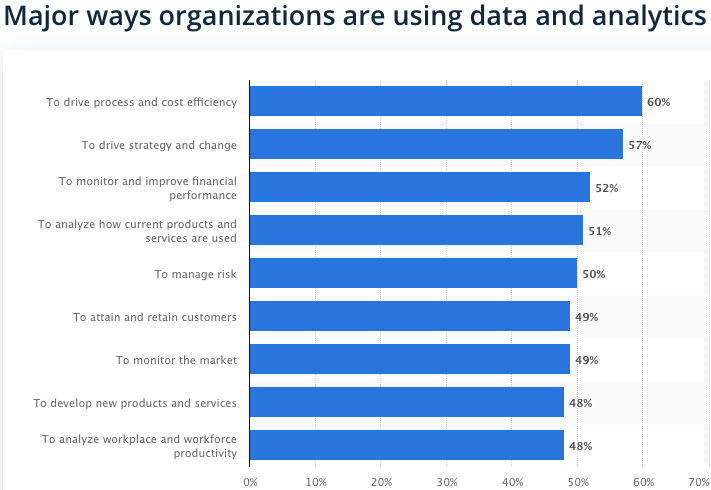
Analytical data gives businesses clarity and efficiency
Google Analytics Alternatives
Google Analytics has plenty of alternatives. Some are free, and some are not. Some offer unique features, while others only copy GA. The following are the most utilized
Yandex.Metrica
(2+ million users)
It’s the only free alternative from the list. In addition to the regular traffic reports, it offers
Matomo
(780+ thousand users)
These guys are concerned about privacy and data ownership. Matomo is free only if you host it on your server. It mostly copies GA but offers SEO reports. A trending tool that is on the rise!
Hotjar
(760+ thousand users)
More an additional tool to Google Analytics, rather than an alternative. They provide heatmaps, session recordings, polls, and surveys — a trusted brand and reliable partner.
Google Analytics Enhanced Ecommerce
GA Enhanced Ecommerce is a
There are over 14 million
If you are..
- selling products online;
- want to increase the checkout performance;
- want to learn how advertising is pushing sales;
- or want to trace product attributes as custom dimensions or metrics;
..then Enhanced Ecommerce is a
GA Enhanced Ecommerce use cases:
- Track the sales in “recommended” or “most viewed” categories. Do you need to revise your merchandising?
- Inspect movements within the cart (or basket) — adding, deleting, viewed/sold ratio. Investigate where and why your customers vanish.
- View all steps the customer goes through before a purchase. Maybe you can shorten the way and make it faster.
We’ll talk about the benefits of Google Analytics Enhanced Ecommerce more a little later, exploring the reports.
Google Analytics is Free
Totally! But not entirely. Though the free version gives users a huge mass of detailed information, it can’t meet all Enterprise companies’ requirements. Remember the Google Marketing Platform and its Analytics 360 solution? It can. And it’s paid.
But don’t worry, you’re not missing out on anything
- 400 max of property views instead of 200 (later about the structure)
- Data freshness SLA (4 hours)
Cross-property roll-up reporting- Advanced attribution model (whatever it means)
- Partner support (the most valuable)
How many of these items will make your life easier? Stick with the free version, mainly because it will save you 150,000 USD per year — that’s where the pricing starts.
Use Google Analytics Enhanced Ecommerce for online stores. It’s powerful, accurate, and free to use.
How Google Analytics Works
You can skip this one if you don’t care about the subject. But you’ll miss a few interesting things.
The code
Google Analytics adds a block of JavaScript code on all pages of your website. When users view a page, this JavaScript code references a JavaScript file, starting a tracking process for Analytics. The operation retrieves data about the page request through various means. It sends this information to the Analytics server via a list of parameters attached to a
Sounds difficult? Take a look at this easy to follow the flow.
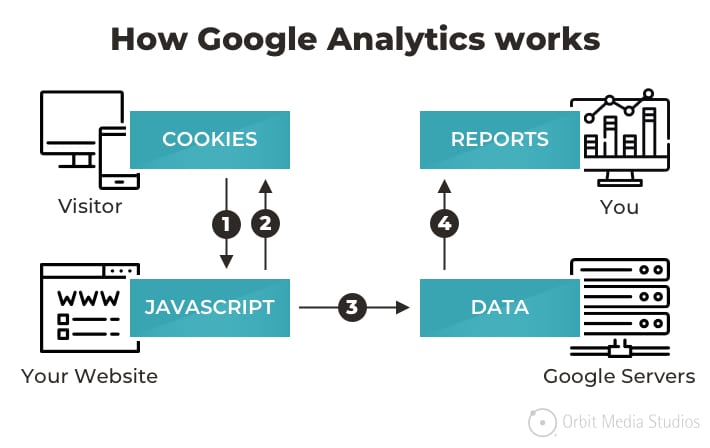
Long data journey. Image source: orbitmedia.com
The admin panel structure
Once the code is in the code, you can log in to the admin panel. You will see the hierarchy structure — Account, Property, and View. We’ll talk about setting up Google Analytics in the next chapter, but first, let’s fly through the structure.
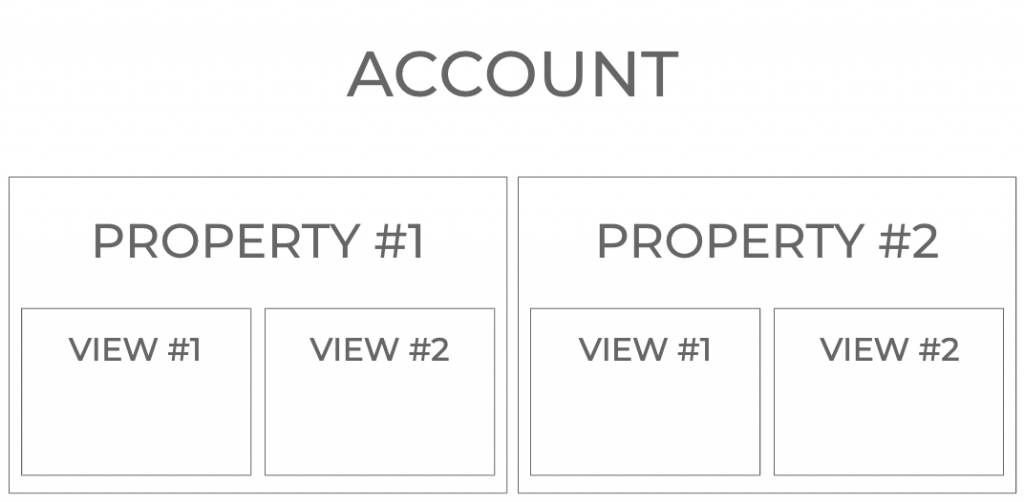
Google Analytics account structure
Account
Using Google Analytics requires at least one Account. This is a home for all your business data — your website, blog, subdomains, or other owned resource. And it’s split into different rooms — Properties.
Each user has the key to enter this house, but not necessarily into any room. Each Account can have up to 50 Properties. If you have several businesses, you may want to use different Accounts for them.
Properties
If you want to split the access to different resources related to one business for different types of users — use Properties. Each property has a personal tracking code. Property = website, app, or subdomain. These are your rooms.
The editorial team may track only the Blog. The human resources team needs to follow the career portal, the
View
But what’s inside the room?
We can compare views with different angles of view or windows. Each view is your data but with different filters. For example, to analyze traffic from a particular country or specific devices. Or, this is a common practice to exclude your company colleagues’ visits and your own.
The same with windows. If you look into the room through different windows, you won’t see the same picture. One Property can have 25 Views.
Watch the video by Google if you still have the questions.
The cookies and identification
To learn that two different sessions or clicks belong to the same user, Google Analytics assigns a unique identifier to each user when they enter your website. It’s called the Client ID and is randomly generated. Any action of the user and the associated identifier is being recorded and stored in the browser cookies.
Using cookies allows GA to identify unique users across sessions in the same browser, but it can fail to identify users entering the website with different browsers or devices.
An HTTP cookie (also called web cookie, Internet cookie, browser cookie, or simply cookie) is a small piece of data stored on the user’s computer by the web browser while browsing a website.
Google Analytics accuracy
It’s hard to admit, but Google Analytics, even Analytics 360, is not 100 percent accurate. Good news: GA accuracy is somewhere between
Why does this happen?
Just because we have so many interfaces and devices to communicate with the web, GA is technically incapable of associating every session with an identified user. Visiting a website with different browsers (Chrome or Safari) or apps (Facebook app or Twitter app) — all those can be different users for GA, even if it’s the same person.
That’s why Google Analytics uses sampling. We won’t bother you with the math, just take this example by Google support:
“if you wanted to estimate the number of trees in a
Google Analytics allows you to organize data of multiple web resources (or even businesses) in one place and explore it from different angles. It uses cookies to identify users, but sometimes it fails and uses statistical synthesis.
How to Set Up Google Analytics
- Sign up for Google Analytics. You will be asked to create a Google account if you don’t have one.
- Add your website to Google Analytics. This step enables GA to work throughout your site.
- Get your web property ID. This is the unique tracking code that GA generates. It can be found in Admin → Property → Tracking Info → Tracking Code.
- Add tracking code directly after the tag of your website. You will need access to your website code.
- Verify the code is working. Visit the GA account to do that.
How to Set Up Google Analytics with Ecwid
Setting up Google Analytics with your Ecwid store is almost the same, but does not require dealing with the code.
When you have a tracking ID, login to your Ecwid control panel, go to Settings → Tracking & Analytics and enter the web property ID from into the Google Analytics ID field in
Within 24 hours, GA will start tracking data about visitors to your store, and you can generate relevant reports to help you optimize your business.
For detailed instruction with screenshots, visit How to Add Google Analytics to Your Online Store.
Best Google Analytics plugins for WordPress
If you’re using WordPress as your primary platform for an online business, then you have an option to use
Optimonster, a conversion rate optimization blog, provides the following top list as of May 2020.
Top 3 are:
- MonsterInsights — a leader with 2+ million active installations.
- ExactMetrics — it’s free.
- Analytify — with advanced extensions.
Best Google Analytics plugins for Ecwid
The Ecwid App Market hosts several apps to help with sales reports and traffic analysis in your online store:
- Convead. Visualize sales funnels, segment customers, and make personalized product recommendations.
- Kliken Stats.
Real-time conversions, product and category sales, time to purchase, and your online store revenue.
Setting Up Google Analytics Preferences
Now, when you have a Google Tracking ID installed into your store, let’s dive into the admin preferences. There’re lots of them, but don’t worry, they all have tips about what they mean and why use them.
Here’s the entire structure.
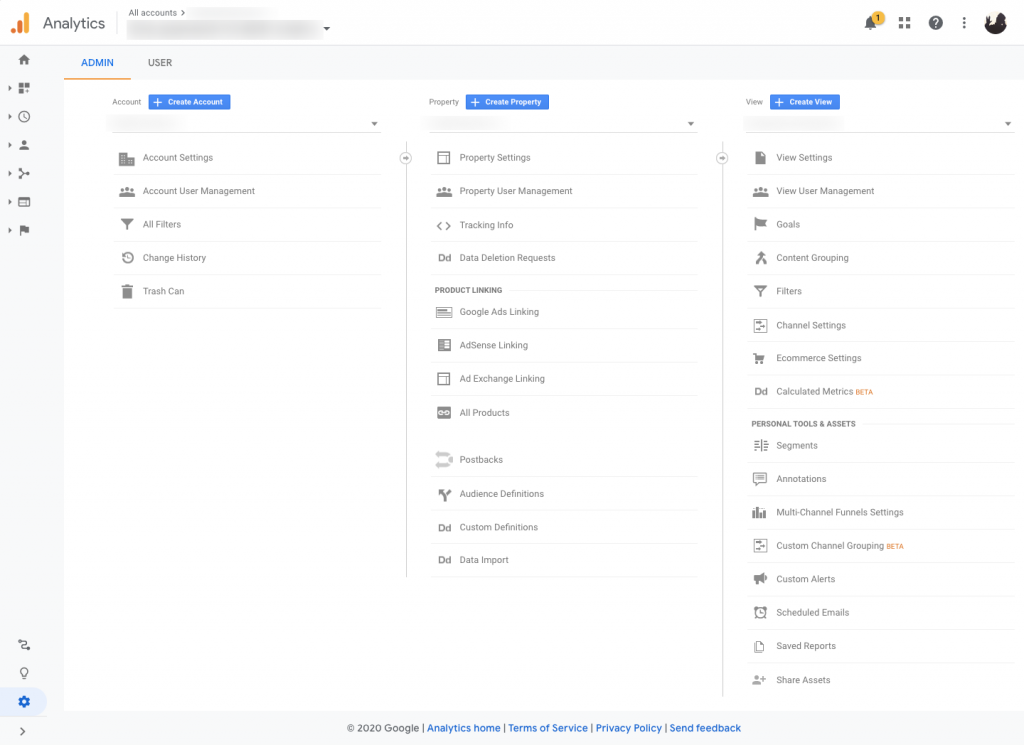
Google Analytics Admin Structure
There are some essential sections you have to check to make sure you get the correct data.
Account
- Account Settings. It contains basic information about you. It also has all agreements between you and Google. Make sure you check or uncheck them.
- All Filters. This is the place to filter out bots or company traffic, for example.
- Change History and Trash. Two sections that let you restore things if you made a mistake.
Property
- Property Settings. The section contains general rules related to a website or app, like name or industry.
- Tracking Info → Tracking Code. The place where you take the Tracking ID or a Global Website Tracking Tag.
- Tracking Info → Data Collection. A place to activate remarketing.
- Tracking Info → Data Retention. Tell Google to keep your data for an unlimited time. A GDPR thing.
- Audience Definitions → Audiences. Create remarketing audiences here. Use segments or parameters for precise targeting.
View
- View Settings. Set up a time zone, currency, and the name. The section has a valuable
check-box: Exclude all hits from known bots and spiders. Make sure to check. - Goals. The most critical section, where you define what you measure. It has a variety of presets. Each View can have 20 Goals, and the Goals are different for different Views.
- Ecommerce Settings. In this area, you enable Enhanced Ecommerce reporting.
Go through all settings one by one and activate all you need. It’s easy with the tips, just needs some time. But clean data is worth the investment.
Google Analytics Reports
Before you can create custom reports, and get insight into your business, familiarize yourself with the Google Analytics dashboard.
GA reports: web traffic
When you first log in to GA, you will see a screen like this:

Explore Google Analytics reports one by one.
Let’s take a look at each element on this dashboard in more detail:
- Use this field to change the date range for each report.
- This graph shows changes in traffic daily. The default view shows the total number of sessions.
- This section shows critical traffic and engagement data, including pageviews, bounce rate, and each visit length. Generally speaking, your objective should be to increase a visitor’s average session duration, reduce the bounce rate, and increase pageviews.
- This pie chart gives you a quick overview of the number of repeat vs. new visitors. A larger number of repeat visitors indicates loyal, returning customers.
- Use the Customization section to create custom dashboards for you or your team.
- The Real Time dashboard shows you traffic and engagement figures on a live,
real-time basis. - Use the Audience section to drill down on data related to your audience’s location, browser, platform, demographics, and interests. You can also do cohort analysis and visualize your audience’s flow through your site.
- The Acquisition section shows you how you acquired your customers, whether through search, social, referrals, advertising, or direct visits from typing your site’s URL into the browser bar.
- Use the Behavior tab to understand how visitors interact with your site. Besides measuring site speed and content popularity on a
per-page basis, you can also conduct A/B testing here to identify the best possible page layout for maximum engagement. - The Conversions section is useful for tracking conversion rates for your stated goals. There is also a separate tab for
e-commerce tracking, enabling you to check sales and product performance.
It’s easy to get overwhelmed with all these tabs and sections, but as an
The most important thing right now is to get comfortable navigating through GA and familiarize yourself with the data in different sections.
For example, if you wanted to see a traffic breakdown by source, you would go to Acquisition → All Traffic → Channels.
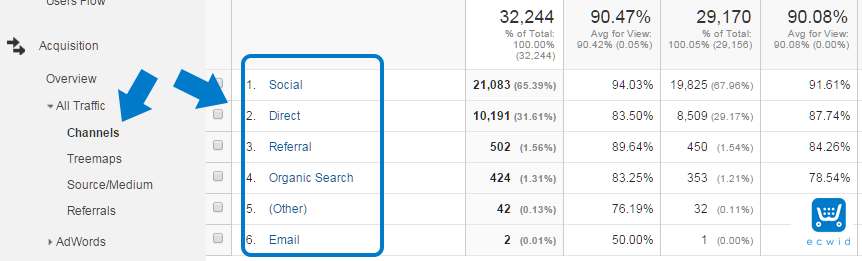
Traffic sources grouped by Google Analytics
This would show you how many visitors you received from each traffic source. You can see a further breakdown of traffic by going to All Traffic → Source/Medium.
These reports are incredibly powerful, but they don’t give you all the data you need at a glance. For that, you need a custom dashboard. Continue reading to find out how to create custom dashboards.
GA reports: Enhanced Ecommerce
Advanced reports on shopping behavior will help you understand your customers much better.
Overview
The Overview report displays an overall status of your online store and provides three categories of related metrics:
- Revenue and Conversion Rate. The total revenue from web
e-commerce orin-app transactions.E-commerce conversion rate — the percentage of visits that resulted in ane-commerce transaction. - Transactions. The total number of completed purchases on your site.
- Marketing. Statistics about Campaigns, Order Coupon Code, Affiliation.
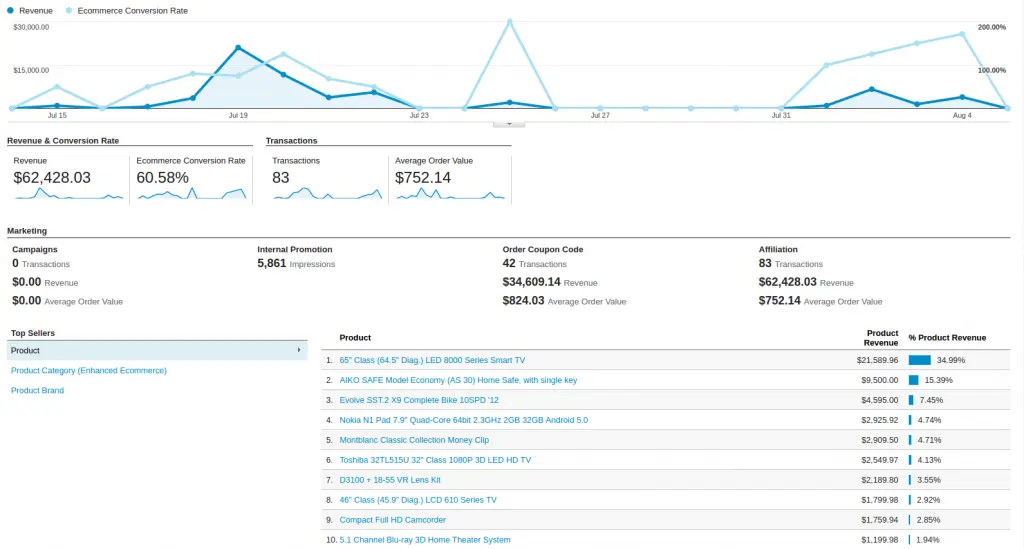
GA Enhanced Ecommerce reports focus on products and sales. Image source: simtechdev.com
Shopping Behavior
The report lets you see how the customers are going through each stage of the shopping funnel, how many sessions complete their journey, and how many abandon the funnel at each stage. Based on that, you can create user segments and analyze their characteristics. Just click on the blue columns to do that.
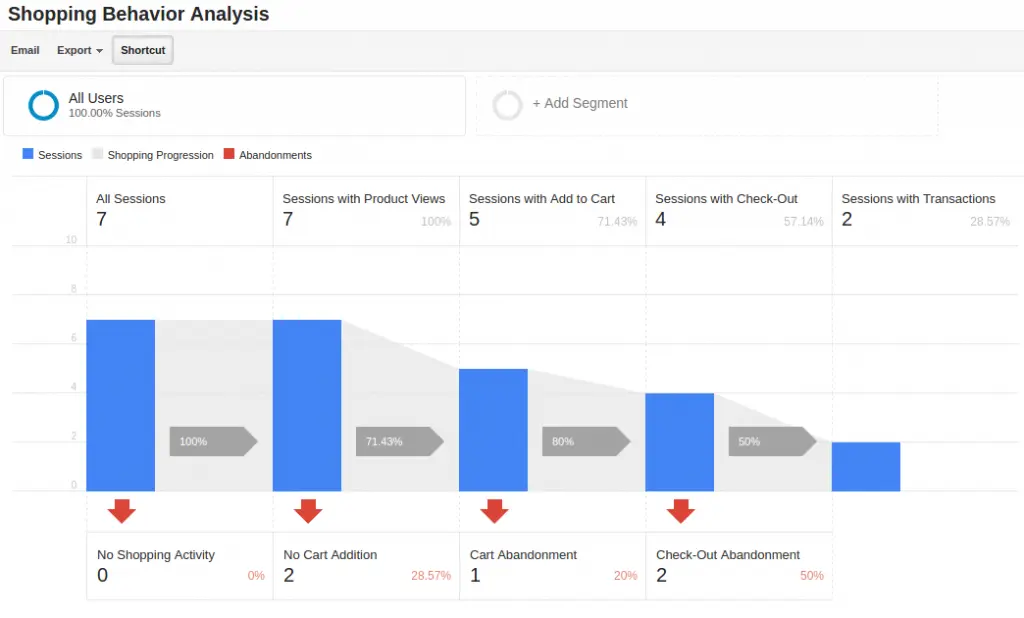
Watch how customers flow through your sales funnel with GA Enhanced Ecommerce
As mentioned in Monetate Ecommerce Quarterly Report, the average conversion rate for
Checkout Behavior
Having reached a checkout, visitors are not customers yet; they are still making decisions.
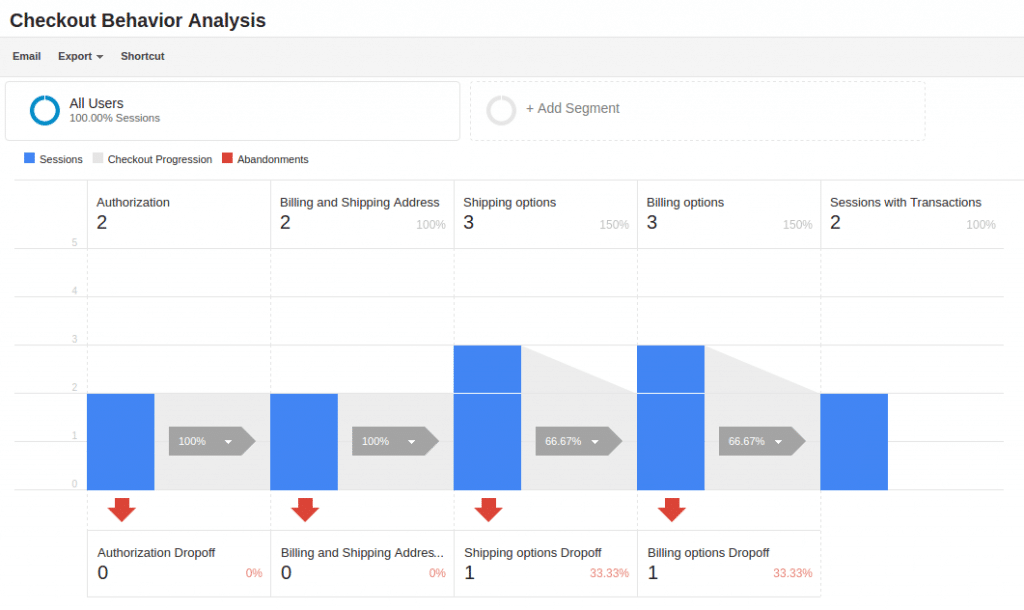
Keep an eye on the checkout behavior. Help customers complete the purchase.
The Checkout Behavior Analysis report gives you a clear overview of where the consumers leave precisely in the checkout process. They made a long way to give you the money finally, but something distracted them or scared them away. Find out what that was.
Product Performance
This report will tell the story about your inventory: Product, Product SKU, Product Category, Product Brand. Analyze product performance and organize them to boost sales.
Sales Performance
The Sales Performance report brings in more financial related data:
- Transaction ID
- Revenue
- Tax
- Shipping
- Refund Amount
- Quantity
Compare your revenue and shipping costs on a diagram. Watch the progress of each feature in dynamics. Use secondary dimensions for more insights about your audience and sales.
Product List Performance
The Product List Performance report helps you understand how blocks, categories, and search results lead to the product.
You may have only one category — “All products.” But if you organize the inventory in multiple categories, using “New,” “Recommended to you,” or “Bestsellers” to stimulate buyers’ interest, the Product List Performance report will tell you which works best and brings you more revenue.
Another use example: combine underperforming products to
Marketing
This section provides an overview of how your main marketing initiatives perform. It collects the data about:
- Internal promotions
- Order Coupons
- Product Coupons
- Affiliate Code
We’ll talk about all marketing reports of Google Analytics Enhanced Ecommerce and how to use them to increase sales in another blog post. Let me know if you want it right away, and I’ll get down to writing.
TLDR. Check out this excellent and detailed video by Luc Durand, an expert with a
How to Use Google Analytics
Now, when you’ve gone through all the settings and reports, you might want to get some action! Enter your Google Analytics account. Let’s go!
Google Analytics dashboard overview and customization
The first thing you will see entering the Google Analytics admin panel is the dashboard. The dashboard is the heart of Google Analytics. While you can view individual reports by navigating to each section, the dashboard gives you critical data about your store at a glance:
- Sessions
- Users
- Bounce rate
- Active users right now
- Traffic channels info
- Events stats
- Retention information
- Geo and devices
These brief reports will be shown in widgets as graphs or tables.
The first thing you’ll want to do in GA is to create a custom dashboard for your store. Once created, you can customize it to show different segments and metrics such as traffic, revenue, conversion rates, etc.
To create a new dashboard, go to the main menu on the left side of the screen. Find Customization → Dashboards → Create. You should see a
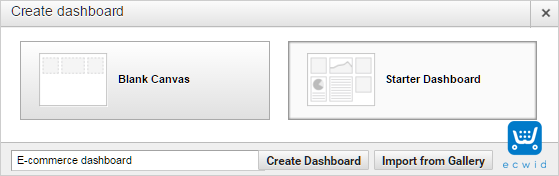
Create a dashboard to see the entire picture quickly
Choose “Starter Dashboard,” give it a name, and click on Create Dashboard.
You should see a screen like this:

This dashboard has space for 12 different widgets. Each widget displays a specific data set of your choosing. You can also add one by clicking on “Add Widget.” You should then see a screen like this:

Here, you can choose a name for the widget and the graph type. You may also change the metric it displays, as well as the widget’s grouping.
Once you hit “Save,” this widget will be added to your dashboard.
You can also create custom Sessions by clicking on the “Add Segment.”

By default, GA shows data from All Sessions — this means it will initially show you all traffic, regardless of the source. You can change this to only show data to your liking, whether it’s new visitors, paid traffic, organic traffic, mobile traffic, etc.
By getting data from different sessions and creating custom widgets, you can get powerful insight into your store’s performance.
Of course, working with all this data can be confusing for anyone new to analytics. If you have specific questions, the odds are that someone else has had them before. Check out the GA help forum to get a better insight into how custom dashboards work.
Essential Google Analytics dashboards for e-commerce stores
One of the most powerful resources for Google Analytics is the GA Solutions Gallery.
This is a curated collection of custom dashboards, segments, and reports from the Google Analytics team. It’s an excellent resource for small business owners struggling to understand how GA reports work.
You can use one of these solutions templates for your store by clicking the Import button that appears next to the template name.

Experiment with Google Analytics dashboards to find the one that works for your business.
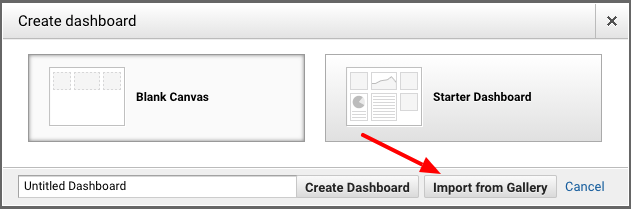
Alternatively, you can use these reports by logging into your Analytics account and going to Dashboard → New Dashboard. On this screen, click on Import from Gallery to create a custom dashboard from the GA Solutions Gallery.
You don’t have to use any of the dashboards from this gallery, but it’s highly recommended that you do when you’re starting. Not only will you get a better understanding of how the pros organize their data, but you’ll also save a lot of time.
How to set up and use Google Analytics Audiences
How to separate all your traffic by age, geographical location, average order value, or visited pages?
Use GA Audiences.
You can find the Audience settings in the Admin → Property → Audience Definitions → Audiences.
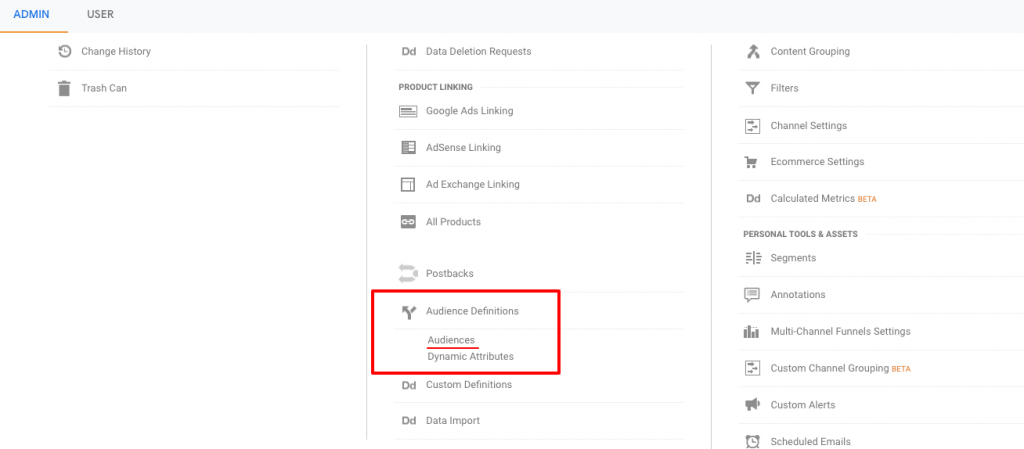
Find the Audiences in the property settings
What is Google Analytics Audiences?
The Audience in GA is a group of people that fit a filter defined by you. You won’t know their names, emails, or any other private information, but you will have all of them packed into one pocked.
Having them all isolated, you can apply metrics to them only to see their effectiveness, or run promotional campaigns (if GA is synced with Google Adwords) targeting only them.
How to set up GA Audiences?
There are three ways you can do it:
- take a
built-in predefined audience designed by Google; - import from community gallery;
- or create a Custom Audience.
You can also create an Audience based on the Segment, but that’s also Custom, isn’t it? Gog to Segment section (following) to find out more.
Google recommended Audiences
- Smart List: Google will use machine learning to create the audience for you.
- All Users: All users to your site or app.
- New Users: Users with only one session on your site or app.
- Returning Users: Users with more than one session on your site or app.
- Users who visited a specific section of my site/app: Specify the URL or directory on your site, or a screen in your app, and all who visit it will go to the Audience.
- Users who completed a goal conversion: Everyone who achieved the Goal. You will have to create a Goal to use this one.
- Users who completed a transaction: All users with more than zero transactions.
These default Audiences are well enough to cover most use cases, but if you have something more complicated on your mind, Custom Audiences is your way.
Import from the gallery
This is an easy way to explore what people use and find an idea that will work for you.
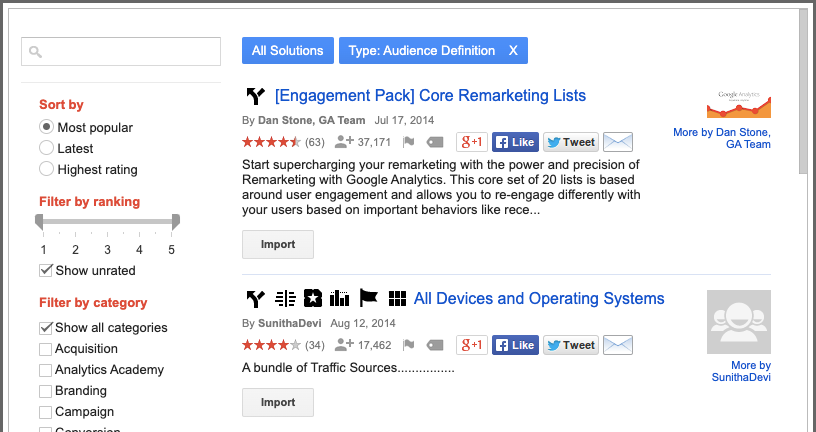
Read the comments, find out why people like these audiences
GA Custom Audiences
To create a Google Analytics Audience from scratch, you will need to:
Admin → Property → Audience Definitions → Audiences → New Audience
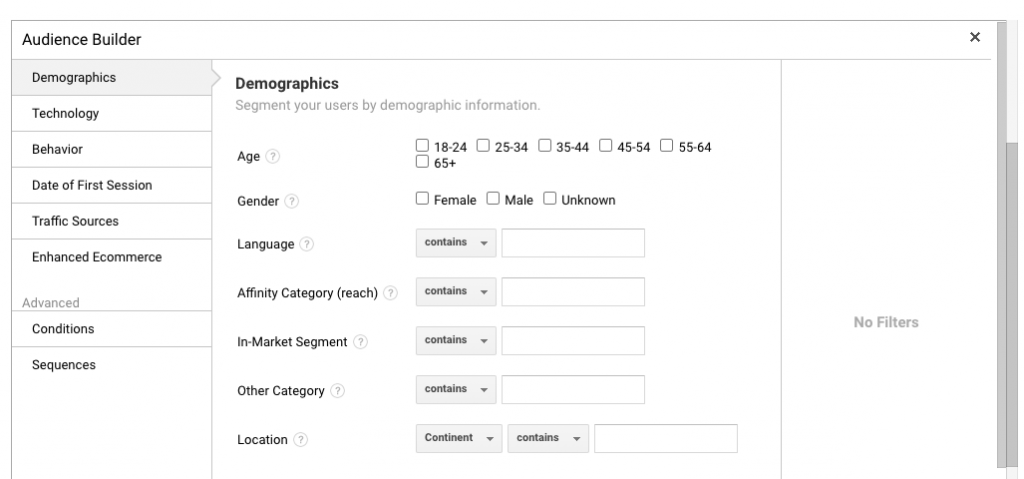
Create custom audiences when you need to improve targeting for better performance
As you see, numerous filters are waiting for you inside. No need for us to go through all of them right now.
Just make sure you know who you’re targeting, why, and what you’re going to do with them.
Ways to use GA Audiences
Using different Audiences will help you better understand your visitors and optimize your website, online store, or even the business: design specific products, services, customer journeys, and, overall, experience.
Meet them, predict them, and fulfill their expectations. In our everyday life, we call it building relationships.
Reese Garcia, Director of Paid Search — eCommerce at KlientBoost, shares his views on how you can use Audiences. And he is talking about remarketing first. He is a real pro and never stops exploring. That’s an example of his Custom Audience.
Reese is playing hard to maximize remarketing performance based on custom audiences
When it comes to creating remarketing audiences in Google Analytics, the options are almost limitless.Reese Garcia
What is Google Analytics Segments and how to use them
GA Segment is an isolated subset of your traffic data based on the filters you set, like age, country, purchasing activity, or devices.
For example, you can create a Segment of users who regularly purchase some sort of product and find out what country they come from. Or on the contrary, a segment based on geographical location will tell you what people from a particular country usually buy.
You might ask: “What’s the difference between Audiences and Segments?”
In simple words — the purpose. Audiences are used for commercial purposes, while Segments are for live reporting and analysis. Nevertheless, your Segments and Audiences can be equal.
How you can use Segments
- Compare Segment A conversion with all traffic conversion.
- Compare Segments A website load speed with Segment B.
- Find out how millennials come to your store.
- Learn what devices (users of these devices, of course) bring you more revenue.
- And so on, and so on.
All these segments can be later compared, converted into graphs, imported to Audiences.
Find the most profitable Segment and create an Audience based on it. Use the Audience for remarketing or search ad campaigns to drive more sales.
That’s how it usually works. No magic.
Creating Google Analytics Segment
… is easy. The only problem you may face is to make a decision: what Segment you need. The variety of filters is crazy!
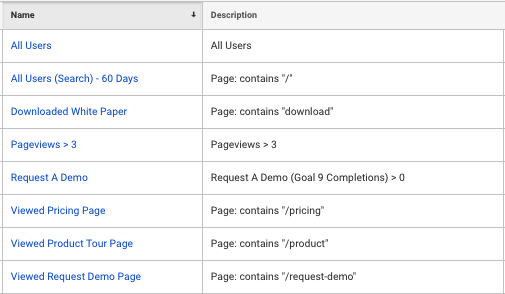
But like in the case of Audiences, Google is here to help. The first Segments you’ll want to test are the presets. There’s plenty of them.
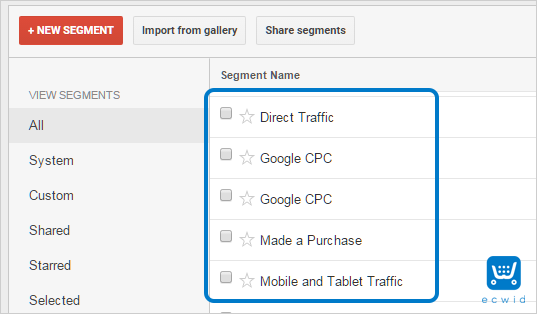
Open any report, and on the top of the page, you will see the Segments selected. Click Add Segment.

You will see the default Segments created by Google.
Try adding any Segment to the dashboard and compare the metrics. Visualization will give you insights about how it works and what you might want to see next.
This takes us to the next chapter about how you can use Google Analytics to measure your store’s success.
Comparing data in Google Analytics
Comparing data and periods will display dynamic progress (trends) of your store and activities.
Comparing periods in Google Analytics
Why would you want to do that?
For example, you’ve changed your online store’s design and want to know how traffic metrics changed this month compared to the previous month.
To compare two different date ranges, select the Compare checkbox, select Custom, Previous Period, or Previous Year. Use the controls to set the second date range. Click Apply.
Try comparing different periods to find the trends
Comparing Segments in Google Analytics
We’ve talked about this previously, but here’s a picture that tells the story.
Let’s compare All traffic versus Mobile traffic. As you remember, after that, I can leave only one Segment (like Mobile) and continue exploring only it.
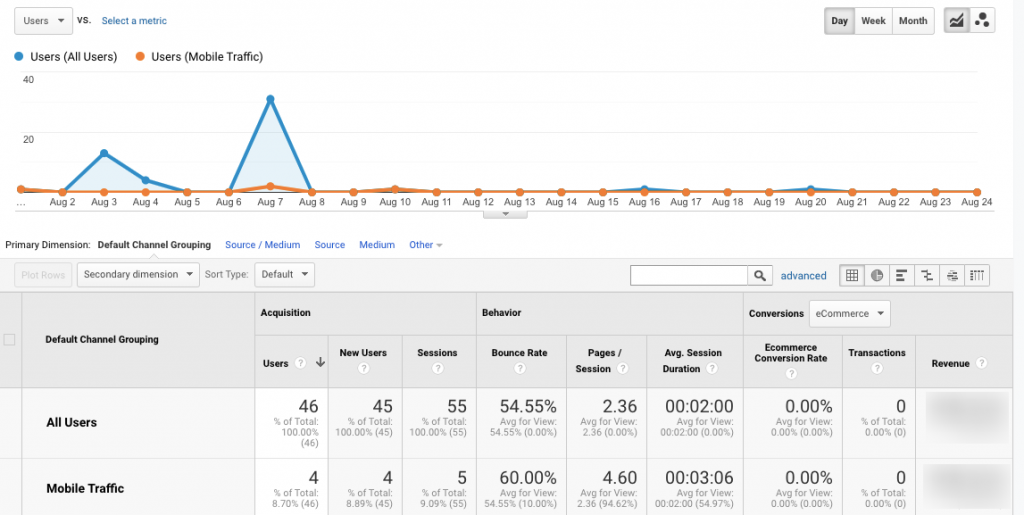
Try this simple example. Find out how well your mobile customers perform.
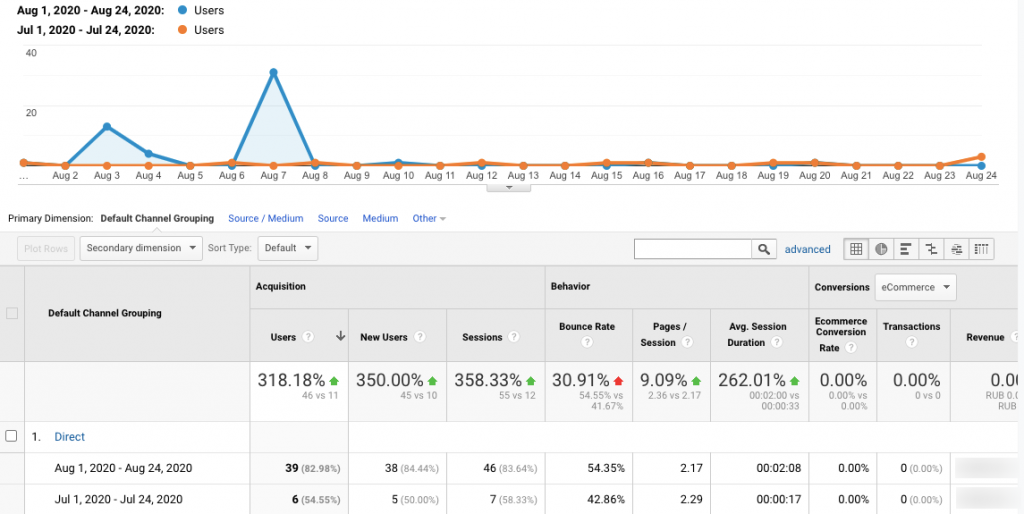
Comparing traffic channels in Google Analytics
You can use Segments to do that for complex analysis, but you can use checkboxes near each channel on the Acquisition → All Traffic → Channels report for a glance. Take a look. Check the boxes, click Plot Rows.
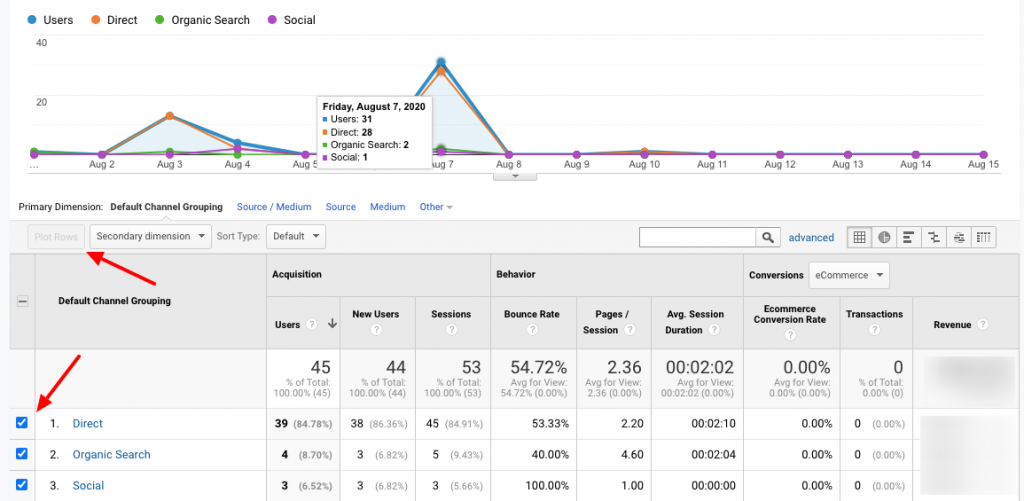
Compare traffic channels to find the one that generates more revenue
Comparing product performance in Google Analytics
What sells best, and what brings all the money? Business is meant to generate profit; otherwise, there’s no point in business at all.
Analyzing your products is a big thing, and you can find a ton of information about how your products are sold in the Product performance report of the Enhanced Ecommerce section. Look into Conversions → Ecommerce → Product Performance to explore:
- Customer satisfaction with the number of refunds
- Investigate “problem products” that no one buys
- Fix product detail pages
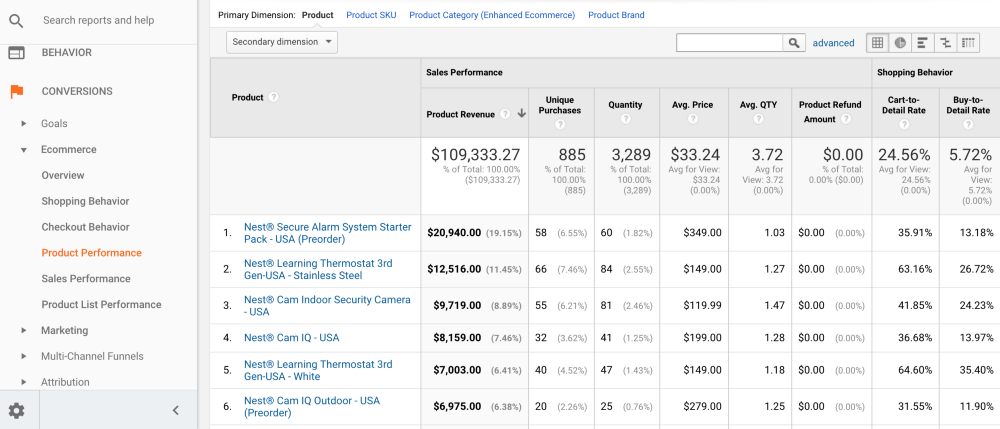
Focus on what is important. Image source: Patrick Han at medium.com.
Create Segments, compare data, measure everything! Search for the gaps and perspectives.
Advanced Features of Google Analytics and Actionable Tips
You’re doing well. You’ve gone so far!
Now, when you’re reading this, you know all the basics of Google Analytics:
- The benefits and ways of tracking business data.
- How Google Analytics helps to analyze big data and how it works.
- The reason why GA Enhanced Ecommerce reports change the game.
- How to set up and use Google Analytics the right way and collect precise data.
- The power of Segments and Audiences for analysis, reporting, and advertising.
- Why comparing traffic Segments, products, and date periods rules.
Time to get to advanced features of GA: automation,
Google Analytics Insights: ask questions
Did you know that you can ask Google Analytics questions?
For example, you can ask: “What was the average conversion rate last week?” And GA will show you the graph in a few seconds.
Question answering feature is a part of the Google Analytics Insights tool and uses machine learning to analyze your request and get you the most relevant data.
To test the feature yourself, go to any GA view that has data and use the search box on the top of your screen — it’s always there.
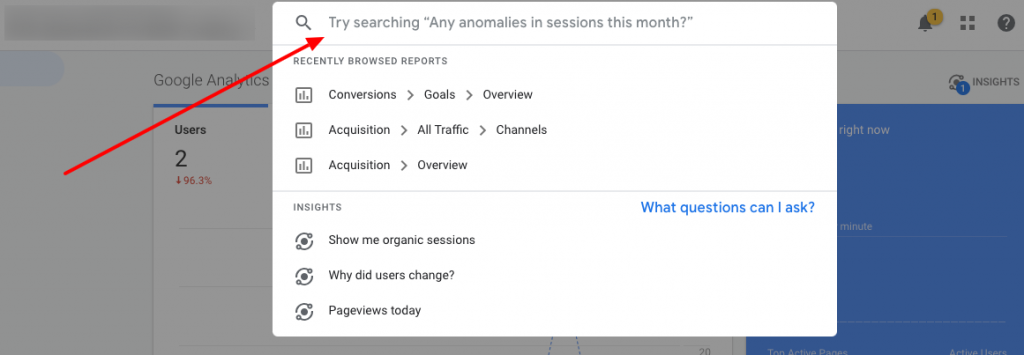
Ask Google Analytics for direction
But before using the answering feature, make sure your request is as specific as possible. Machine learning is smart, but it’s still a machine.
Best practices you should follow asking Google Analytics questions:
- Use Metrics/Dimensions terminology (Countries, Users, Revenue, etc.)
- Specify date ranges (last week, last year, today, etc.)
- Growth period (YoY, MoM, etc.)
- Use exact language for custom Events and Goals (“How many Goalname?”)
If the question you want to ask matches the list, you’re good to go.
Watch the following instruction by Neha Bansal from Google. She was the one who designed the Question answering feature.
Custom Channel Grouping: advanced precision
Unfortunately, Google Analytics can’t always be correct, splitting the traffic by the source channels. Sometimes, it just can’t identify it correctly and assigns users somehow near the truth, based on any available triggers.
Sometimes, it is just not enough
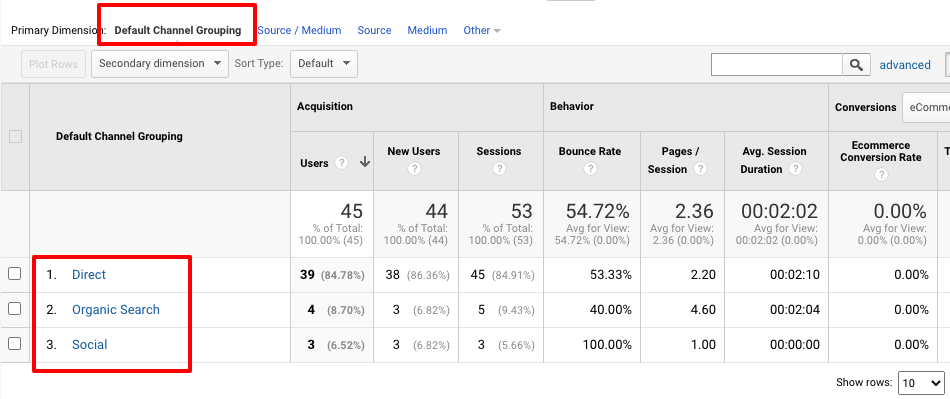
The Default Channel Grouping (GA manual) is not perfect, although it contains most major source variants:
- Direct
- Organic Search
- Social
- Referral
- Paid Search
- Display
- Other
You can sometimes find traffic from Facebook (with Facebook referrer) in the Referral traffic, or traffic from uncommonly used search engines (like DuckDuckGo) in the Direct group. Even a small uncertainty may result in significant problems if you make decisions based on the data.
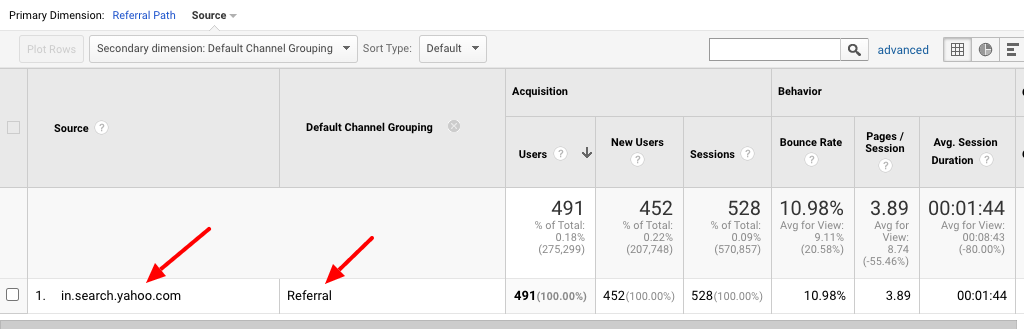
That is how it happens!
If you want your analytics to be as clean and precise as possible, Custom Channel Grouping is exactly what you need.
Create a new channel, add rules which GA will use to assign the traffic to the channel, and launch.
Sounds easy?
And it is, but it will take a lot of time if you have massive traffic from many resources because you’ll have to manually scan all the data.
Creating the grouping rules will require using some of the following parameters: referrer, source, medium, campaign, and others.
Scrolling down the reports, channel by channel, find the anomalies, and add them to the rules one by one.
Pro Tip #1
Setting up the Channels, remember that their position matters. Make sure the Channels that should be filtered out first are at the top of the list. The traffic will be going and filtering through the channel from top to bottom.
Watch how a Google Analytics expert explains the process. The video is a bit old, but it will take you through the admin, which looks almost the same today.
Set up on-site search and search terms
Searchers convert twice better, according to Moz. Moreover, 30 percent of the visitors will perform an
Searchers convert x2 better than
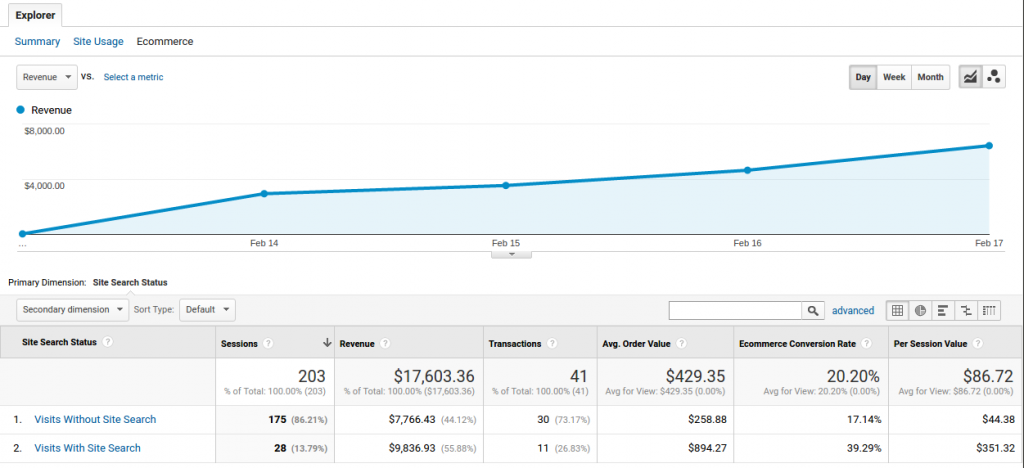
Searching visitors have more specific shopping intent than visitors who are simply browsing. They are willing to buy. Do you want to know the answers to the questions:
- What are they searching for, and what do they finally find and buy?
- How well do the searchers convert in your store?
- Evaluate the revenue generated by the
on-site search?
No problem. Google Analytics provides a dedicated section for “Site Search” reports.
Pro Tip #2
Trackon-site search. Help customers find what they already want to buy.
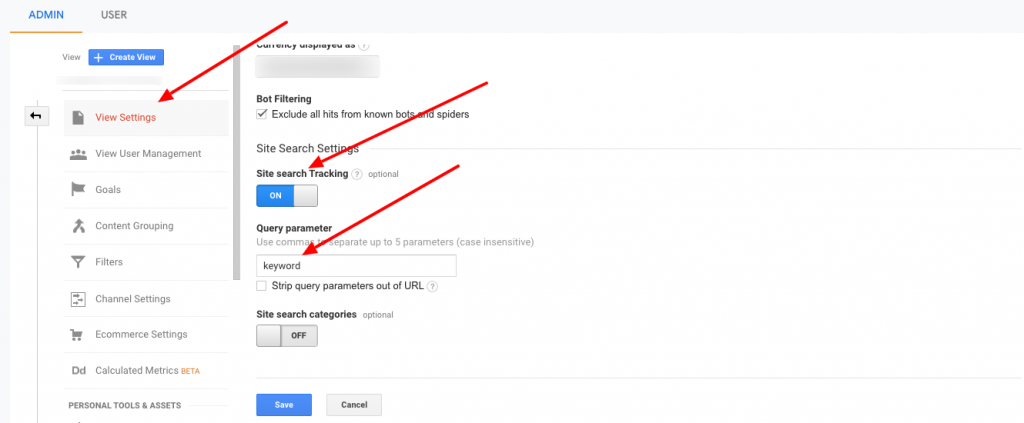
Setting up Site search tracking with Ecwid
Go to the Admin → View → View Settings. Find and turn on Site Search Tracking. In the Query Parameter field, enter the word “keyword” — this is an internal query parameter. Other search apps could have different query parameters. Read How to identify search query parameters.
Do not forget to activate
Automate GA reports with Scheduled Emails
In case you didn’t know, you can save lots of time on entering the GA admin every day to track your favorite reports.
Automate reporting by scheduling emails with these reports and get them right into your mailbox at the specific time.
Open the Report you want to get regularly and click the Share button on the top of the screen. Fill out the dialog box, select the format of the report (CSV, TSV, TSV for Excel or PDF) using the “Attachments”
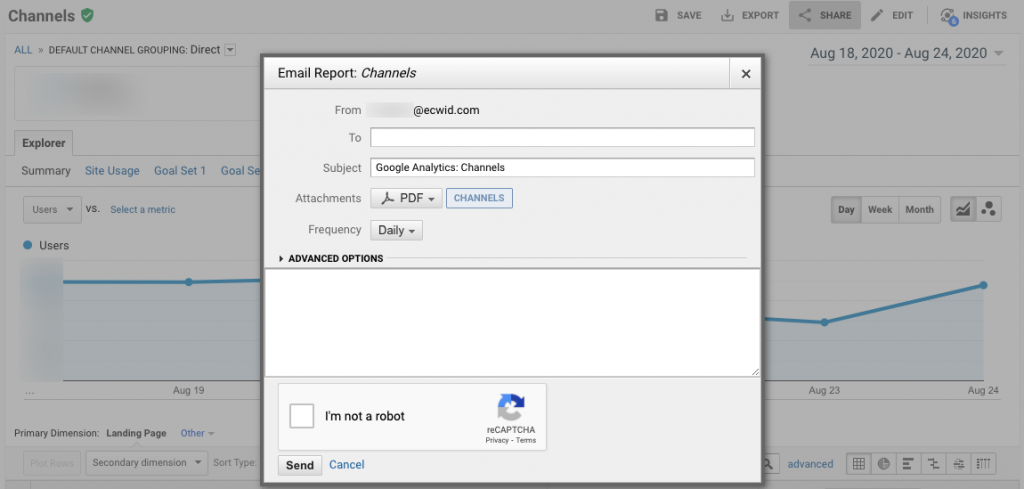
That’s it! Now you and everyone from the “To” field will receive the report according to the preferences.
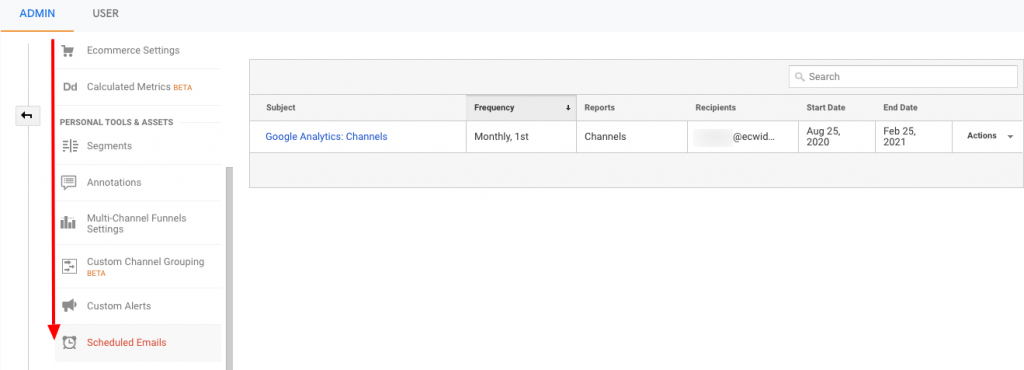
If you want to edit the scheduled emails, track them or delete, go to the Admin → View → Scheduled Emails.
Pro Tip #3
Automate reports, value your time! It’s limited.
Track Off-site campaigns with UTM tags
One of the most convenient ways to measure and analyze traffic from unowned resources is to add UTM tags to all the links you distribute.
UTM tags, or UTM codes, are the variables you add to the links to track and analyze the pages’ traffic sources.
The link with a UTM tag looks like this: “https://yourshop.com/collection/?utm_source=facebook&utm_medium=social&utm_campaign=BFCM2019”
When visitors click this link, it tells us (and Google Analytics) that they come from Facebook, following a BFCM 2019 offer. Using these parameters, we can filter out all users who went through this link and analyze their behavior.
Read this detailed guide about How UTM Tags Help Analyzing Your Online Shop’s Traffic.
Make sure you use UTM tags to track traffic from:
- Social media
- Other websites (like blogs if you guest post)
- Emails
- Banners across your store
Pro Tip #4
The basic rule for traffic markup with UTMs:
Source = domain
Medium = Channel Grouping
Campaign = Activity reason
Google Data Studio: Visualization and Automation of GA Reports
Accounts, properties, users, goals, segments, audiences, reports, search parameters: everything seems to pile up on you. Things are getting overwhelming.
But hold on, we have the tool that will organize all your data tracking into beautiful, shareable, and automated reports.
Google Data Studio is a free online visualization tool that lets you illustrate the data in powerful reports.
![[Sample] Google Analytics Marketing Website](https://don16obqbay2c.cloudfront.net/wp-content/uploads/Sample-Google-Analytics-Marketing-Website-1598941577.png)
Your online store performance report can look amazing
- Visualize your results.
- Use your data in one place.
- Explore the data from different angles.
- Share the data with other teams and contractors.
- Automate the entire reporting routine.
Google Data Studio is one of our favorite marketing instruments. It’s simple; it’s integrated with the entire Google Marketing ecosystem (only Gmail needed), it saves lots of time for all teams.
And it’s FREE.
Google Data Studio allows us to add several data sources and blend them in a single report, or create separate reports for different teams.
Some of the resources Data Studio can pull data from:
- Google Analytics
- Google Ads
- Search Console
- BigQuery
- YouTube
- Adobe Analytics
- Ahrefs
- Bing Ads
- Salesforce
- Facebook Ads
- … and a hundred of others.
If you can’t find the connector for your data source (which is unbelievable), you can create your own connector.
To start using Google Data Studio (sometimes GDS), Log in to the admin using Gmail and connect your GA. That’s it. You’re clear to create your first report.
Don’t be overly ambitious — start slow.
Data Studio advises you to start by using one of the templates, and we agree.
Open the Acme Marketing template and start exploring the widgets. Don’t be afraid to make a mistake — it’s a natural part of learning.
To help you along the way, here’s a video with a Google Data Studio product manager, explaining how to make your first steps.
We hope you’ll get hooked on GDS and will continue exploring. Let’s search for business perspectives instead of drawing graphs.
If you decide to go deeper, here’s an excellent guide by Aja Frost, a Senior SEO Strategist at HubSpot: The Ultimate Guide to Google Data Studio in 2020. It is highly recommended.
What Google Analytics Can’t Do
It can collect and compare; it can segment and analyze; it can automate and visualize.
Is there anything that Google Analytics can’t do with the data?
The answer is Yes.
- Google Analytics can’t track individual Users. This one relates to privacy protection. Google restricts transmitting personal data of your visitors. Instead, it assigns User IDs, which you can see.
- GA can’t identify returning visitors after they clear browsing data. If they do that, the GA cookie gets lost, and GA gives the same user another ID when they return to your store. This could be a big problem, but fortunately, people don’t clear their history. Or do it rarely.
- GA does not record heat maps of any kind. No click maps, no scroll maps at all. It also does not record session replays either. If you want to analyze your users’ experience, you’ll have to use another tool, like Yandex.Metrica, for example.
- Google Analytics has nothing to do with call tracking. Forget about it. This could be a helpful feature to track mobile visitors. The only option you have to do that is to create an Event. But this won’t take you deep into analytics.
I won’t lie if I say that there are plenty more things that GA can’t do, but mostly they will occur in specific circumstances. If you have any on your mind, let us know, and we’ll add them to the list.
How to Master Google Analytics
Good news here, my friends! Google Analytics provides free online courses in their Google Analytics Academy. The Academy also has classes about Data Studio and Google Tag Manager.
If you decide to examine your skills, visit Skillshop — another Google resource for learners who want to test their knowledge in Google’s professional tools and solutions. If you succeed, you will get a completion certificate confirming you are a qualified Google Analytics professional.
If it’s not enough and you want to go deeper with GA
Closing
Well, that was quite a long run!
Thank you for reading up to the end. I admire your dedication. I bet you still have questions, and you will have even more when you start digging into the data.
But that’s okay, that’s normal. Google Analytics has so much to offer that sometimes I beg for mercy.
But remember that there are almost 30 million users, we’re all learning together.
Data analysis is a continuous journey, an endless voyage for the truth and insights, from one misty island of opportunity to another. The vital thing that should never leave your mind on your expedition is always knowing where your next island is.
You have to know what you search, why, and what you’re going to do next.
FAQ
What is an Event?
Events are user interactions with content that can be measured from a
What is the Goal?
A goal represents a completed activity, called a conversion that contributes to the success of your business. Examples of goals include making a purchase (for an
What is Segment?
A Segment is a subset of your Analytics data. For example, one Segment of your entire set of users might be users from a particular country or city. Another Segment might be users who purchase a specific line of products or visit a particular part of your site.
What is Remarketing Audience?
A remarketing audience is a list of cookies or
What is YoY?
Looking at YoY performance allows for gauging if a company’s financial performance is improving, static, or worsening. For example, in financial reports, you may read that a particular business reported its revenues increased for the third quarter, on a YoY basis, for the last three years.
What is a Dimension?
Dimensions are attributes of your data. For example, the dimension City indicates the city, for example, “Paris” or “New York,” from which a session originates. The dimension Page shows the URL of a page that is viewed.
What is Metric?
A metric is a number that is used to measure one of the characteristics of a dimension.

- Didn’t Migrate to Google Analytics 4? Here Is Why You Need to Do That Now
- Google My Business 360: How To Win A Local Competition
- An Easy Way to Earn More on Google My Business
- A Complete Guide to Google Analytics for Ecommerce
- How to Add Google Analytics to Your Online Store
- How to Set Up Daily Ecommerce Reports in GA
- What Is Google Tag Manager
- How To Use Google Tag Manager
- What Is Google Search Console
- How To Set Up and Use Google Search Console
- Google Domains: What Is It, and How Does It Work?
- Gmail: How to Write and Manage Emails Like a Pro
- The Ultimate Guide to Google Docs


